
Statistic
1Set
I have a set of numbers.From that set of numbers I can extract FOMs (Figures of Merits) that gives me information about the content of the set without having to look at the individual values.

2Sum
In order to extract the all my FOM from the set I only need two aid coefficients, that are the sum of all elements and the sum of the square of all elements.This can be computed efficiently as accumulation and only require one memory slot for each sum, this means it's not required to keep all elements of the set in memory.
This massively help from computational time as well, as there is no need to iterate over N elements every time. The computation time becomes a fixed amount.
These two FOMs embed all statistically relevant information.

3Average
The average of the set is simply computed as sum divided by number of samples.Unit of measure of the average is the unit of measure of the set.

4RMS Average
This FOM has a very deep physical meaning.In many laws of physics, the work done is the integral over time of the square of the effort/flux. The physical meaning or the RMS average is the work done by the set.
From a statistical point of view, the bare average does transmit information about sign or variation. The RMS average does. The two are the same only if the set is flat. RMS average will always be bigger in magnitude than the bare average. The more the spread of the values in the set, the more the RMS value will be compared to the bare average.
Unit of measure of the RMS average is the unit of measure of the set.

5Variance and Standard Deviation
The variance measures how spread out are the elements of the set.The Standard Deviation normalizes the value so that it has the same unit of measure and value magnitude as the elements in the set.

6Recap
Recap of all formulae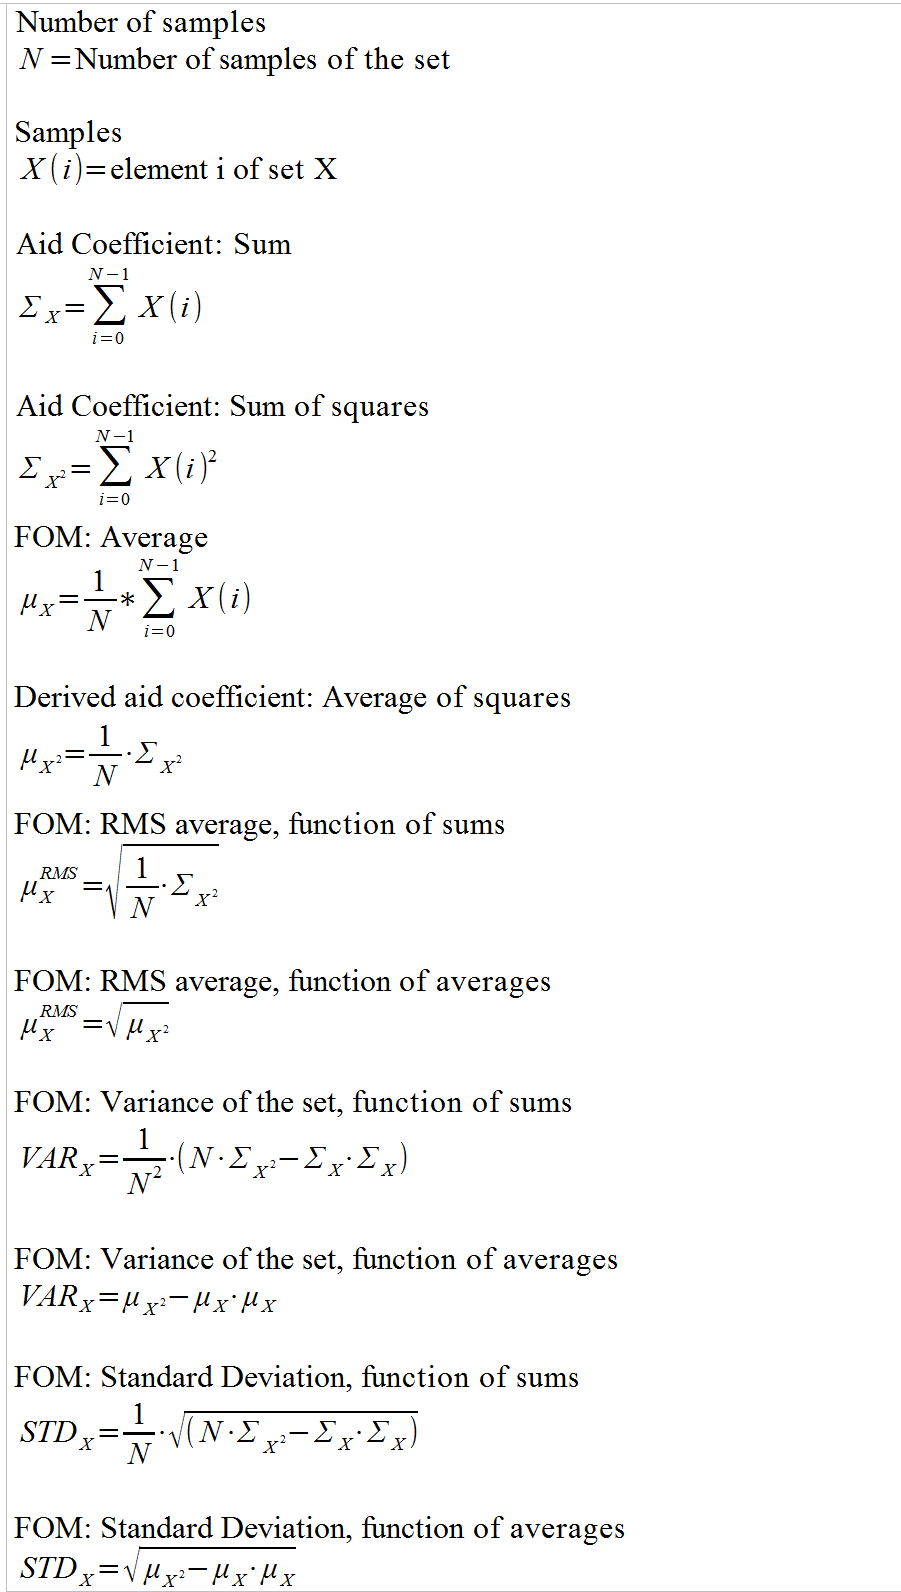
7Example
I have two sets. One with narrow variance, one with wide variance.Set and FOM


7.1 Set A - Meaning of Statistical Parameters
The chart below gives a visual representation of 9 samples of Set A (blue) and its statistic: The average (black), the RMS average (yellow) and the standard deviation (gray).
The average (black) is the mean value of all elements in the set and is visually in the middle of the blue signal.
The standard deviation is small (0.5) compared to the magnitude of the blue signal (4.6). This means the RMS average (4.6) is only slightly bigger than the actual average (4.555).
The standard deviation is referred to a Gaussian distribution. A standard deviation of 0.5 means that:
- 38.2% of entries are expected to be found within +/- 0.25 of
the average of the signal.
- 68% of entries are expected to be found within +/- 0.5 of the
average of the signal.
- 95% of entries are expected to be found within +/- 1 of the
average of the signal.
The RMS average (Yellow) can be interpreted as the effective magnitude of the signal and has a deep physical meaning. For example, the power dissipated by a resistor is proportional to the RMS current, not the average current. For a constant signal, Average and RMS average are the same.
7.2 Set B - Meaning of Statistical Parameters
I do the same for set B that has a different distribution to Set A. The chart below gives a visual representation of 9 samples of Set B (red) and its statistic: The average (black), the RMS average (yellow) and the standard deviation (gray).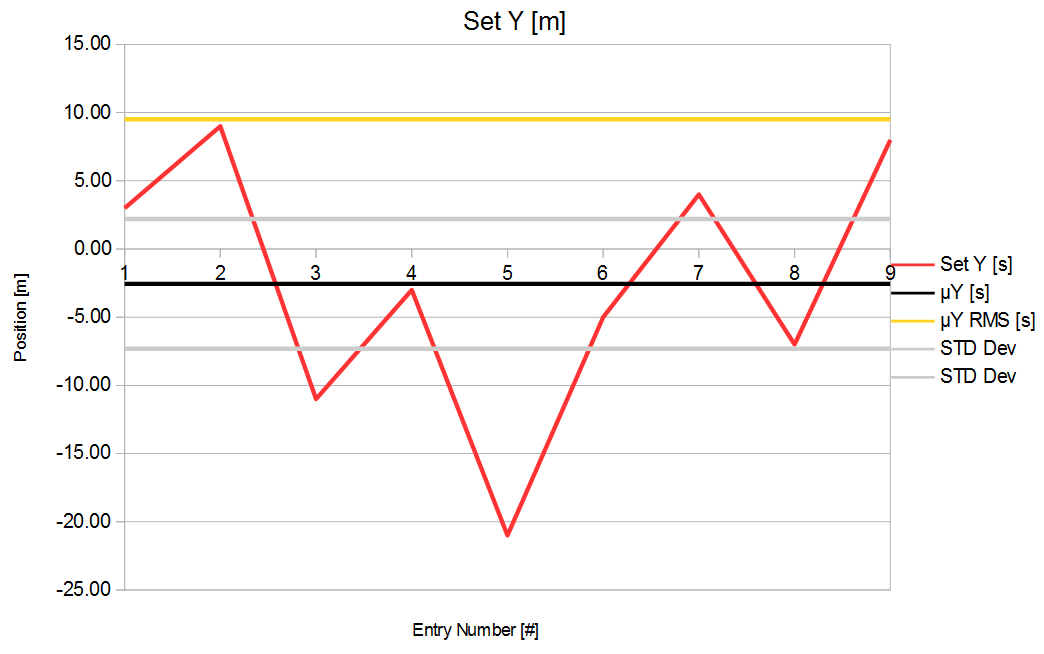
The average (black) is the mean value (-2.555) of all elements in the set and is visually in the middle of the blue signal.
The standard deviation (9.17) is comparable to the magnitude of the blue signal (9.5). This means the RMS average (9.5) is much bigger than the actual average (-2.555). The RMS average (Yellow) is always positive, and bigger or equal to the absolute value of the average.
A standard deviation of 9.17 means that:
- 38.2% of entries are expected to be found within +/- 4.58 of
the average of the signal.
- 68% of entries are expected to be found within +/- 9.17 of
the average of the signal.
- 95% of entries are expected to be found within +/- 18.34 of
the average of the signal.
From the chart, it can be seen that the RMS average yield the average magnitude of the set, while the average yield the center of gravity of the set. The standard deviation yield the average variation around the average the values will have as in a Gaussian curve.
No comments:
Post a Comment